A Public Cloud | Azure customer story
Pernod Ricard Winemakers
Learn how an Azure migration gave Pernod Ricard greater flexibility and improved performance.
Built on a foundation of over 45 years’ experience, combined with world-leading vendor technologies, Data#3 is constantly evolving its solutions and services to enable its customers’ success. Leveraging solutions such as cloud, modern workplace, security, data & analytics and connectivity, combined with Data#3’s services across consulting, project services and managed services, Data#3 is delivering the digital future.

Learn how an Azure migration gave Pernod Ricard greater flexibility and improved performance.

City of Fremantle drives productivity with Microsoft Surface device program from Data#3

Kubota Takes Control of the Future with Network Uplift and Azure Migration from Data#3

BTC Markets Enables Growth and Boosts Security with Cisco Solution from Data#3

Australian Islamic College transforms teaching, learning and IT management outcomes with Microsoft 365

Explore our industry awards.

April 10, 2023; Brisbane, Australia: Leading Australian technology services and solutions provider,…

March 28, 2024; Brisbane, Australia – Data#3, a leading Australian provider of technology services and…
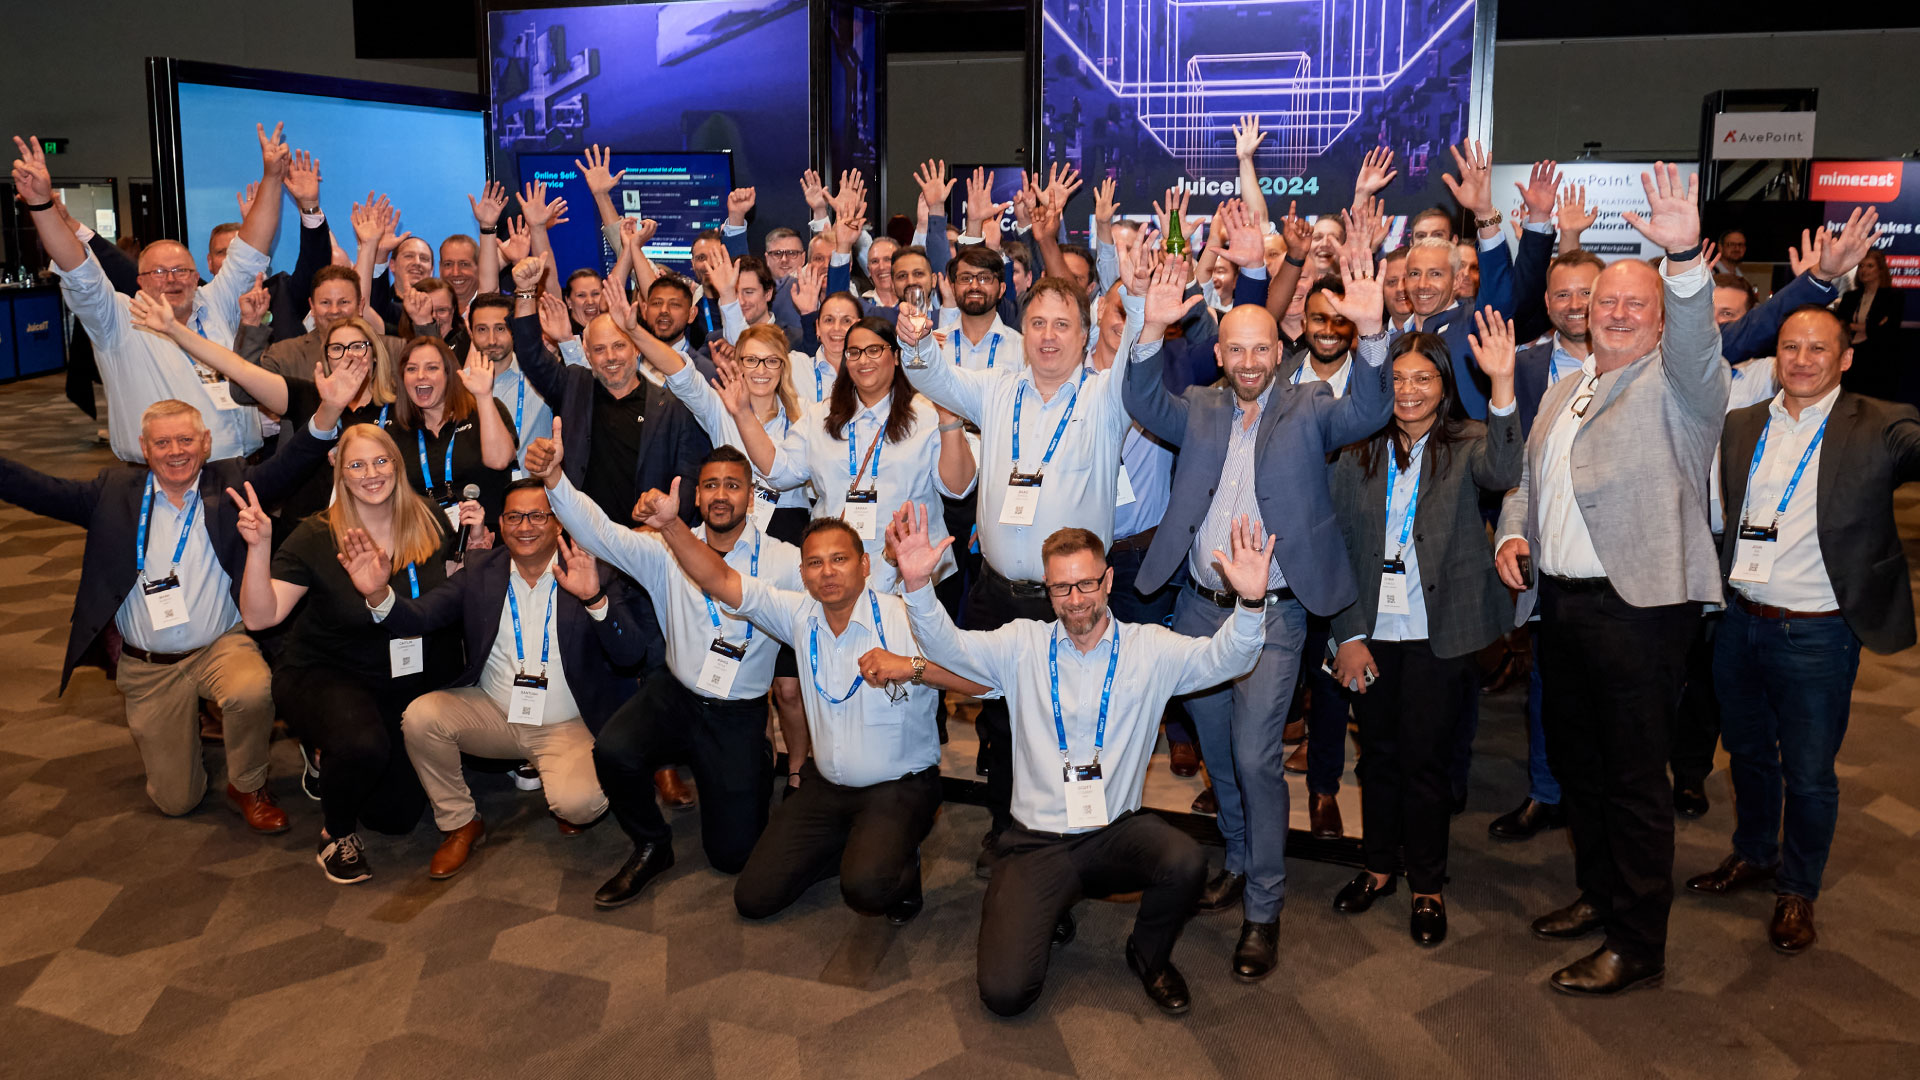
Video highlights from JuiceIT 2024 Brisbane March 22, 2023; Brisbane, Australia: Leading Australian…

BRISBANE, Thursday 15 February 2024: Australian business technology solutions leader Data#3 Limited (ASX:…
BRISBANE, Tuesday 16 January 2024: Australia’s leading IT services and solutions provider, Data#3…

December 20, 2023; Melbourne, Australia: Leading Australian technology services and solutions provider,…

December 14, 2023; Sydney, Australia: Leading Australian technology services and solutions provider,…

December 07, 2023; Brisbane, Australia: Leading Australian technology services and solutions provider,…

November 23, 2023; Brisbane, Australia: Leading Australian technology services and solutions provider,…

November 17, 2023; Brisbane, Australia: Leading Australian technology services and solutions provider,…

November 08, 2023; Brisbane, Australia: Leading Australian technology services and solutions provider,…
November 08, 2023; Brisbane, Australia: Leading Australian technology services and solutions provider,…

BRISBANE, 31 October 2023: Australia’s leading IT services and solutions provider, Data#3 Limited (ASX:…

September 26, 2023; Brisbane, Australia: Leading Australian technology services and solutions provider,…

September 25, 2023; Brisbane, Australia: Leading Australian technology services and solutions provider,…

September 19, 2023; Brisbane, Australia: Leading Australian technology services and solutions provider,…
BRISBANE, 11 September 2023: Data#3 announces that Chairman, Richard Anderson, has advised that he will…
BRISBANE, Tuesday 22 August 2023: Australia’s leading IT services and solutions provider, Data#3…

August 1, 2023; Brisbane, Australia: Leading Australian technology services and solutions provider,…

Data#3 has won a $20.6 million contract to supply Cisco equipment and services to Main Roads WA…
